Simple, reliable democracy data: Introducing Global State of Democracy Indices v7

The seventh annual update to the Global State of Democracy Indices—now covering 174 countries between 1975 and 2022—was recently published by International IDEA. All the data and documentation are available for download on our website.
If you’re a regular reader of blog posts from International IDEA, you are likely the kind of person who knows where to find data on democracy. Following several decades of advances and innovation in democracy data, there is no shortage of options. But the Global State of Democracy (GSoD) Indices occupy a unique niche in this space. The GSoD Indices were intentionally designed to be useful to policy analysts, speechwriters, journalists, academics, and students. Their ability to serve these users rests on two fundamental design choices: (1) to gather data from the best and most comprehensive sources and (2) to aggregate these data in a unique collection of indices that measure the things that matter most.
In informal terms, the GSoD Indices are a democracy data concierge service: the information you need, arranged for you by an expert.
Sophisticated methodology – documented but behind the scenes
These apparently simple and reliable indices of democracy rely on sophisticated social scientific work behind the scenes. Our methods are fully documented and replicable for those users who wish to do so.
A straightforward and (hopefully) intuitive explanation is that each of the indices in the dataset seeks to provide something approaching a consensus measure of the concept of interest. We do this by collecting the best available data (from other data projects such as the Varieties of Democracy project, Bertelsmann Transformation Index, and Freedom in the World), and using sophisticated measurement models to estimate the values of a single index (meaning a composite measure) for each concept (as well as a measure of the uncertainty of that estimated value). Our methods allow data with different scales, distributions, and even informational quality to be aggregated in a way that gives the most weight to the best measures.
Annual updates
Ideally, quantitative data on democracy could be updated at short intervals, for example on a monthly basis (which we do in a qualitative way in the Democracy Tracker). However, the best we can do is to provide annual updates to annual measures of democratic performance. In June 2023, we launched version 7 of the GSoD Indices, now including data from 1975 to 2022. This new version of the dataset not only added another year of observations, but also added six new data sources, and inaugurated a revised conceptual framework that organizes the indices.
New measure of the rule of law
For the first six versions of the GSoD Indices, the conceptual framework was stable. However, over the years we have taken note of feedback from diverse audiences on the ways in which the data could be made even more useful.
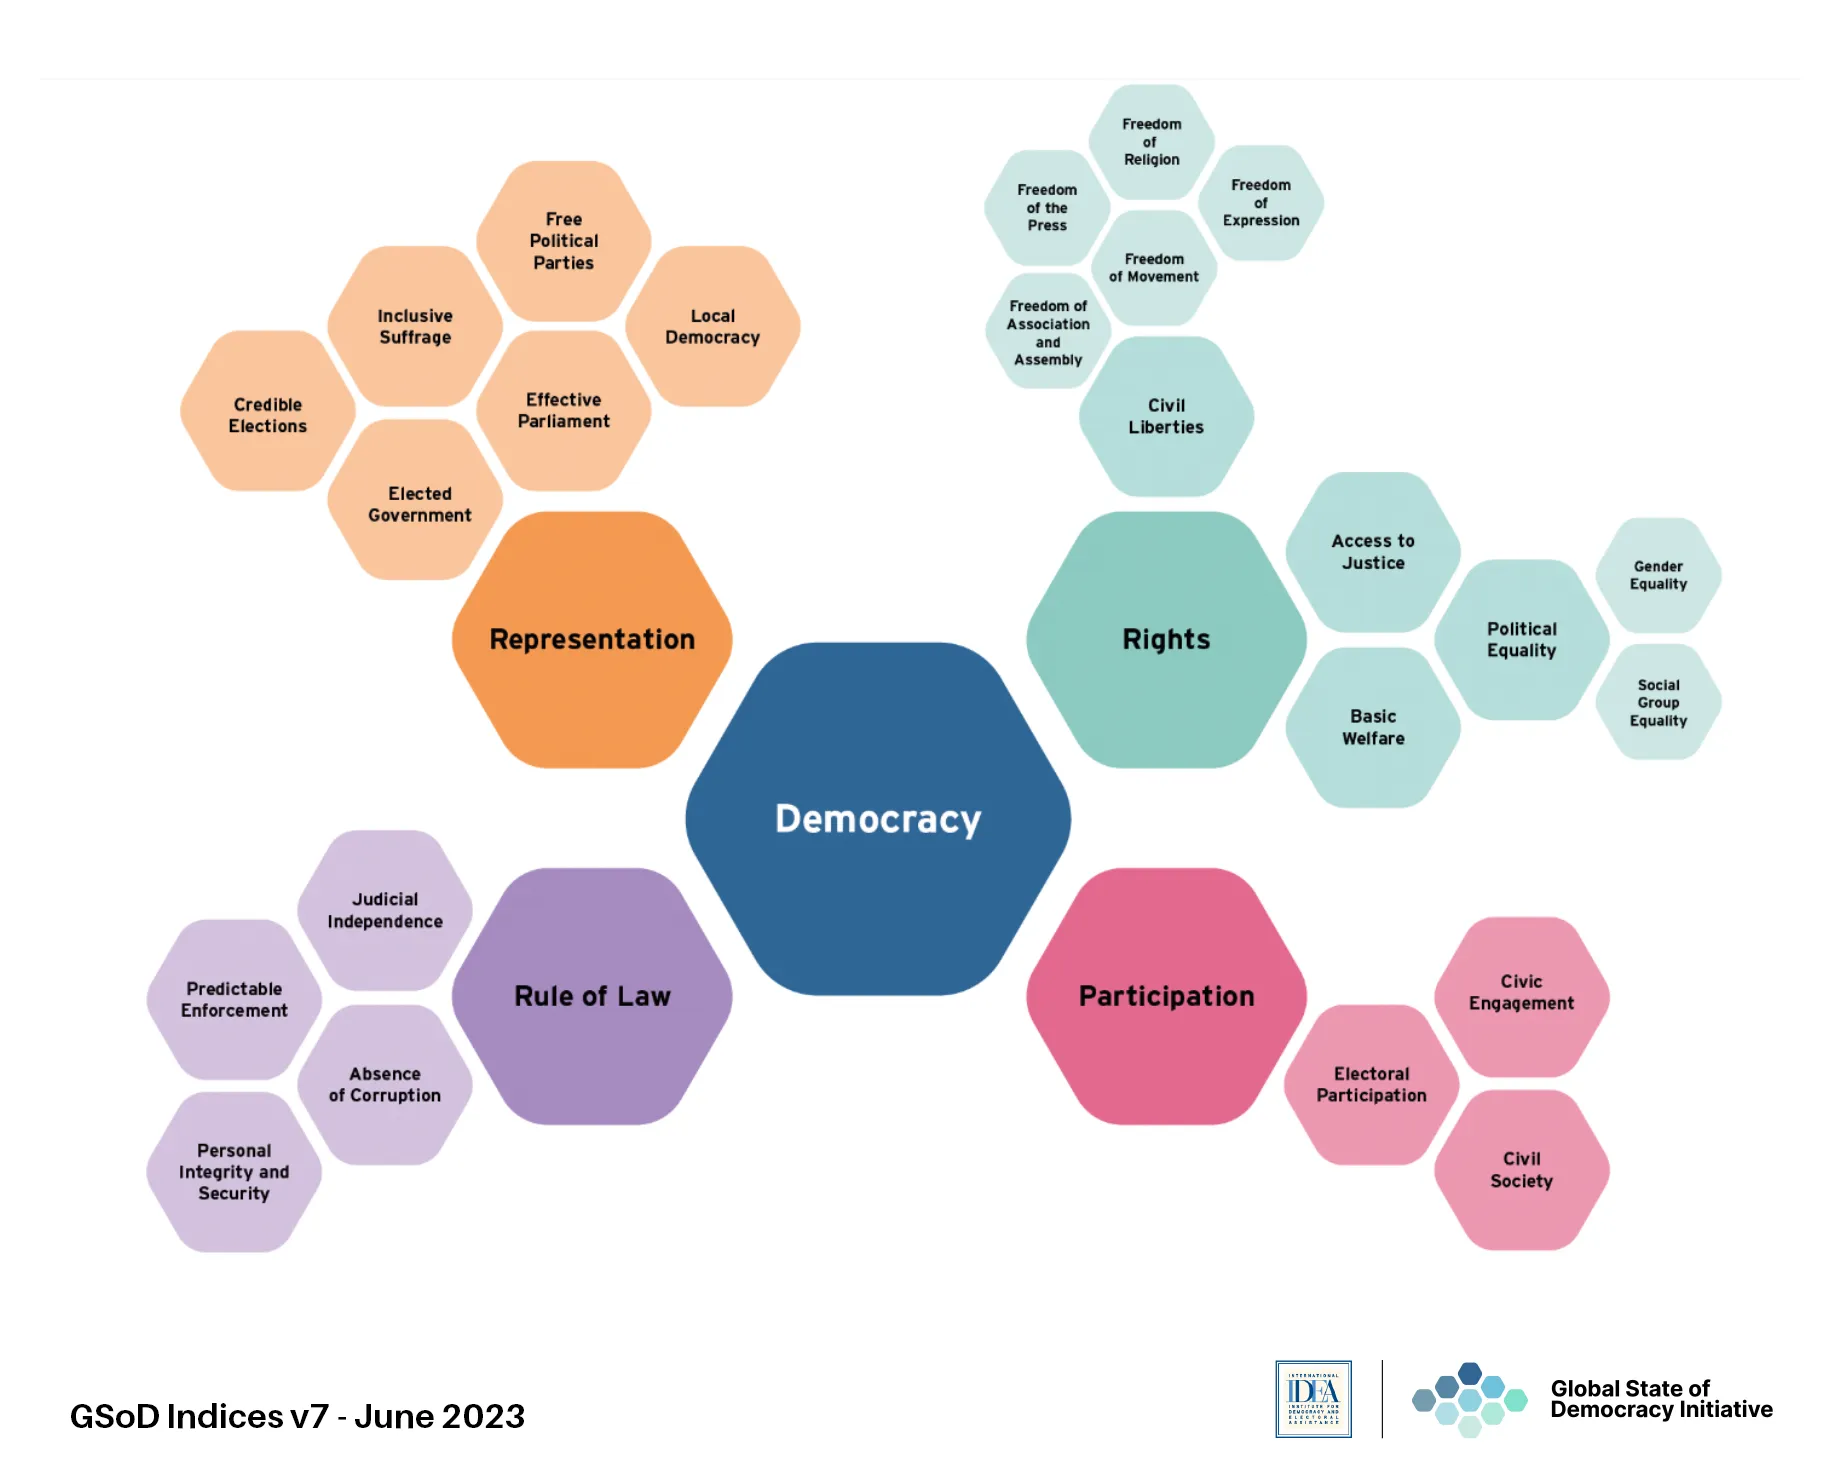
One frequent request was for a measure of the rule of law. For many organizations working on democracy and human rights, this is a key measure, and the GSoD Indices did not consolidate its relevant measures into a singular index. For version 7 of the GSoD Indices, creating a single, reliable, measure of the rule of law was a top priority. We are very happy to share that in consultation with external experts, we were able to create this index. We have reconfigured the conceptual framework so that there are now four top-level indices of democratic quality: Representation, Rights, Participation, and the Rule of Law.
Each of these indices is constructed from several second-level indices (17 in total). Two of the second-level indices are in turn constructed from a third level (this applies to Civil Liberties and Political Equality). On that note, we also added an index of Freedom of the Press at the lowest level of aggregation. This hierarchical arrangement of the indices is illustrated in the figure above.
Uses for the data
The aggregated data are used for many different purposes. Within IDEA, we use the specific measures of things like Credible Elections or Freedom of the Press to track trends within countries, and to identify areas where interventions could be most effective. Other organizations use the data in applications such as human rights due diligence research, risk estimation, and country-specific research.
The graph below illustrates how the various regions of the world compare to each other on each of our four top-level categories of democratic performance.

Interactive website coming in September
We invite you to explore this refreshed and updated conceptual framework through downloadable data files and documentation on our website. And stay tuned for new interactive data pages on the GSoD online platform that we will launch in September.


